MIGEDC’S 2025 1ST QUARTER REPORT
Get to know what the council has been up to from the previous quarter, including programs, projects, and activities which have been completed and in the pipeline.


MIGEDC’S 2025 1ST QUARTER REPORT
Get to know what the council has been up to from the previous quarter, including programs, projects, and activities which have been completed and in the pipeline.


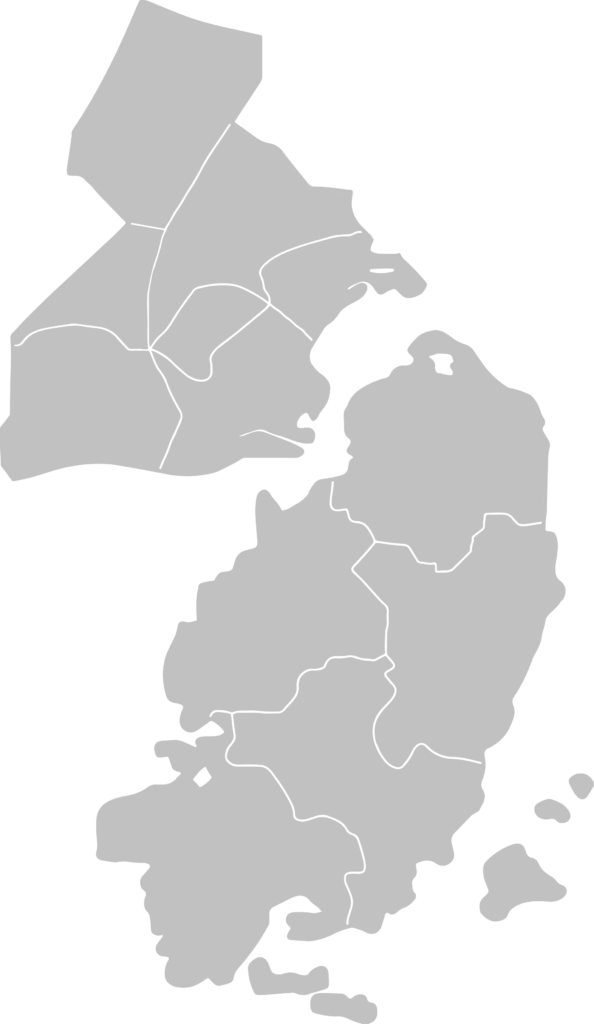
| Land Area (sq km) | 112.90 |
|---|---|
| Population (2020) | 61,110 |
| Pop'n Growth Rate (2010-2020) | 1.07 |
| Pop'n Density (per sq km, 2020) | 541 |
| Land Area (sq km) | 604.57 |
|---|---|
| Population (2020) | 187,842 |
| Pop'n Growth Rate (2010-2020) | 1.43 |
| Pop'n Density (per sq km, 2020) | 311 |
| Land Area (sq km) | 78.34 |
|---|---|
| Population (2020) | 457,626 |
| Pop'n Growth Rate (2010-2020) | 0.75 |
| Pop'n Density (per sq km, 2020) | 5,842 |
| Land Area (sq km) | 32.18 |
|---|---|
| Population (2020) | 34,725 |
| Pop'n Growth Rate (2010-2020) | 1.66 |
| Pop'n Density (per sq km, 2020) | 1,079 |
| Land Area (sq km) | 90.73 |
|---|---|
| Population (2020) | 98,509 |
| Pop'n Growth Rate (2010-2020) | 1.78 |
| Pop'n Density (per sq km, 2020) | 1,086 |
| Land Area (sq km) | 27.03 |
|---|---|
| Population (2020) | 70,388 |
| Pop'n Growth Rate (2010-2020) | 4.90 |
| Pop'n Density (per sq km, 2020) | 2,604 |
| Land Area (sq km) | 31,97 |
|---|---|
| Population (2020) | 30,115 |
| Pop'n Growth Rate (2010-2020) | 1.87 |
| Pop'n Density (per sq km, 2020) | 942 |
| Land Area (sq km) | 131.96 |
|---|---|
| Population (2020) | 67,630 |
| Pop'n Growth Rate (2010-2020) | 2.00 |
| Pop'n Density (per sq km, 2020) | 512 |