MIGEDC Visit the Municipality of Cabatuan

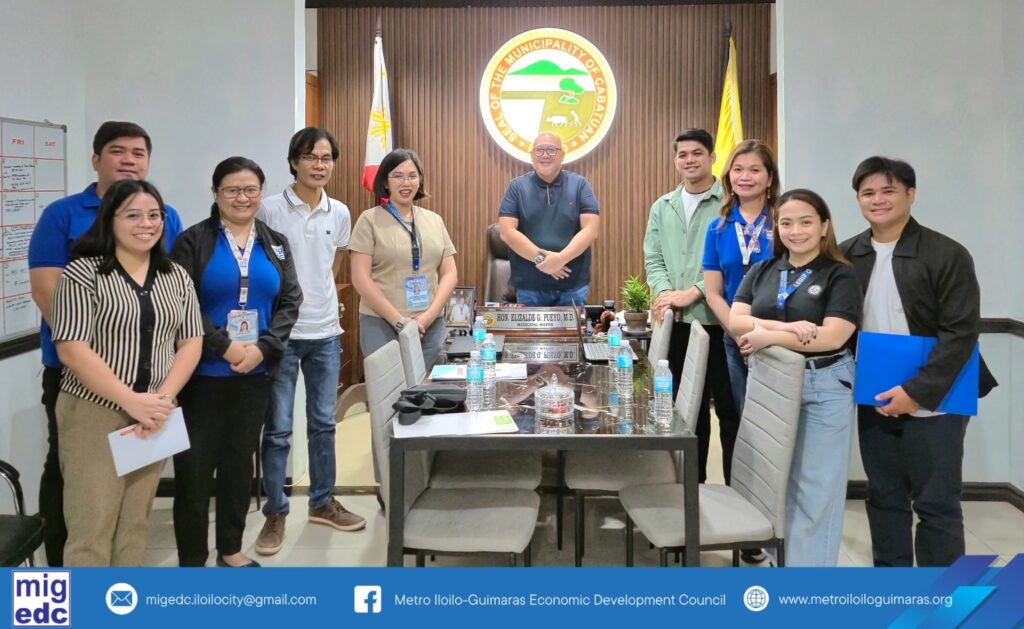
On July 16, 2025, the Metro Iloilo–Guimaras Economic Development Council (MIGEDC) met with Hon. Elizalde G. Pueyo, Municipal Mayor of Cabatuan, to provide updates on the Metro Iloilo–Guimaras 2035 Plan’s Strategic Highway component.

May be an image of 4 people, people studying and text


The discussion focused on key priority areas and actionable steps to support the implementation of the strategy, ensuring that the Municipality of Cabatuan remains aligned with the region’s overarching goals for inclusive and sustainable development.

Total Land Area (sq km)
0
Total population
0
Overall Growth Rate (2010 - 2020
0
Population Density (per sq km, 2020)
0

Cabatuan

Land Area (sq km) 112.90
Population (2020) 61,110
Pop'n Growth Rate (2010-2020) 1.07
Pop'n Density (per sq km, 2020) 541

Guimaras

Land Area (sq km) 604.57
Population (2020) 187,842
Pop'n Growth Rate (2010-2020) 1.43
Pop'n Density (per sq km, 2020) 311

Iloilo City

Land Area (sq km) 78.34
Population (2020) 457,626
Pop'n Growth Rate (2010-2020) 0.75
Pop'n Density (per sq km, 2020) 5,842

Leganes

Land Area (sq km) 32.18
Population (2020) 34,725
Pop'n Growth Rate (2010-2020) 1.66
Pop'n Density (per sq km, 2020) 1,079

Oton

Land Area (sq km) 90.73
Population (2020) 98,509
Pop'n Growth Rate (2010-2020) 1.78
Pop'n Density (per sq km, 2020) 1,086

Pavia

Land Area (sq km) 27.03
Population (2020) 70,388
Pop'n Growth Rate (2010-2020) 4.90
Pop'n Density (per sq km, 2020) 2,604

San Miguel

Land Area (sq km) 31,97
Population (2020) 30,115
Pop'n Growth Rate (2010-2020) 1.87
Pop'n Density (per sq km, 2020) 942

Sta Barbara

Land Area (sq km) 131.96
Population (2020) 67,630
Pop'n Growth Rate (2010-2020) 2.00
Pop'n Density (per sq km, 2020) 512